
The most useful key performance indicators for BHPH success combine leading indicators, which flag risk early, with lagging indicators, which show what has already happened. Broken promises to pay and rising roll rates in early delinquency buckets can signal emerging portfolio trouble, while charge-offs and defaults reveal the financial impact. Tracking both gives you a clearer basis for underwriting decisions and cash-flow forecasts.
That distinction matters because a dealership can appear stable in a backward-looking report even as warning signs build in current accounts. A roll rate shows how accounts move from one delinquency bucket to a more severe one, revealing whether payment problems are spreading. Receivables, account age, and cash collected against forecast add context.
This article explains five practical ways to read these signals together. You’ll learn how leading and lagging indicators, roll rates, receivables, defaults, and collections performance can help you spot portfolio risk, refine underwriting, and improve cash-flow visibility, without treating any single KPI as the whole story.
Key Takeaways
- Track how accounts move between delinquency buckets to spot portfolio risk before it appears in charge-offs.
- Compare kept promises to pay and collection outcomes to identify where follow-up may need attention.
- Use portfolio performance across underwriting ranges and deal criteria to guide policy adjustments.
- Pair early warning signals with lagging results for a more complete view of portfolio health.
- Compare receivables and cash collected with forecasts to recognize emerging cash-flow gaps.
1. What is a “roll rate” in BHPH portfolio management?
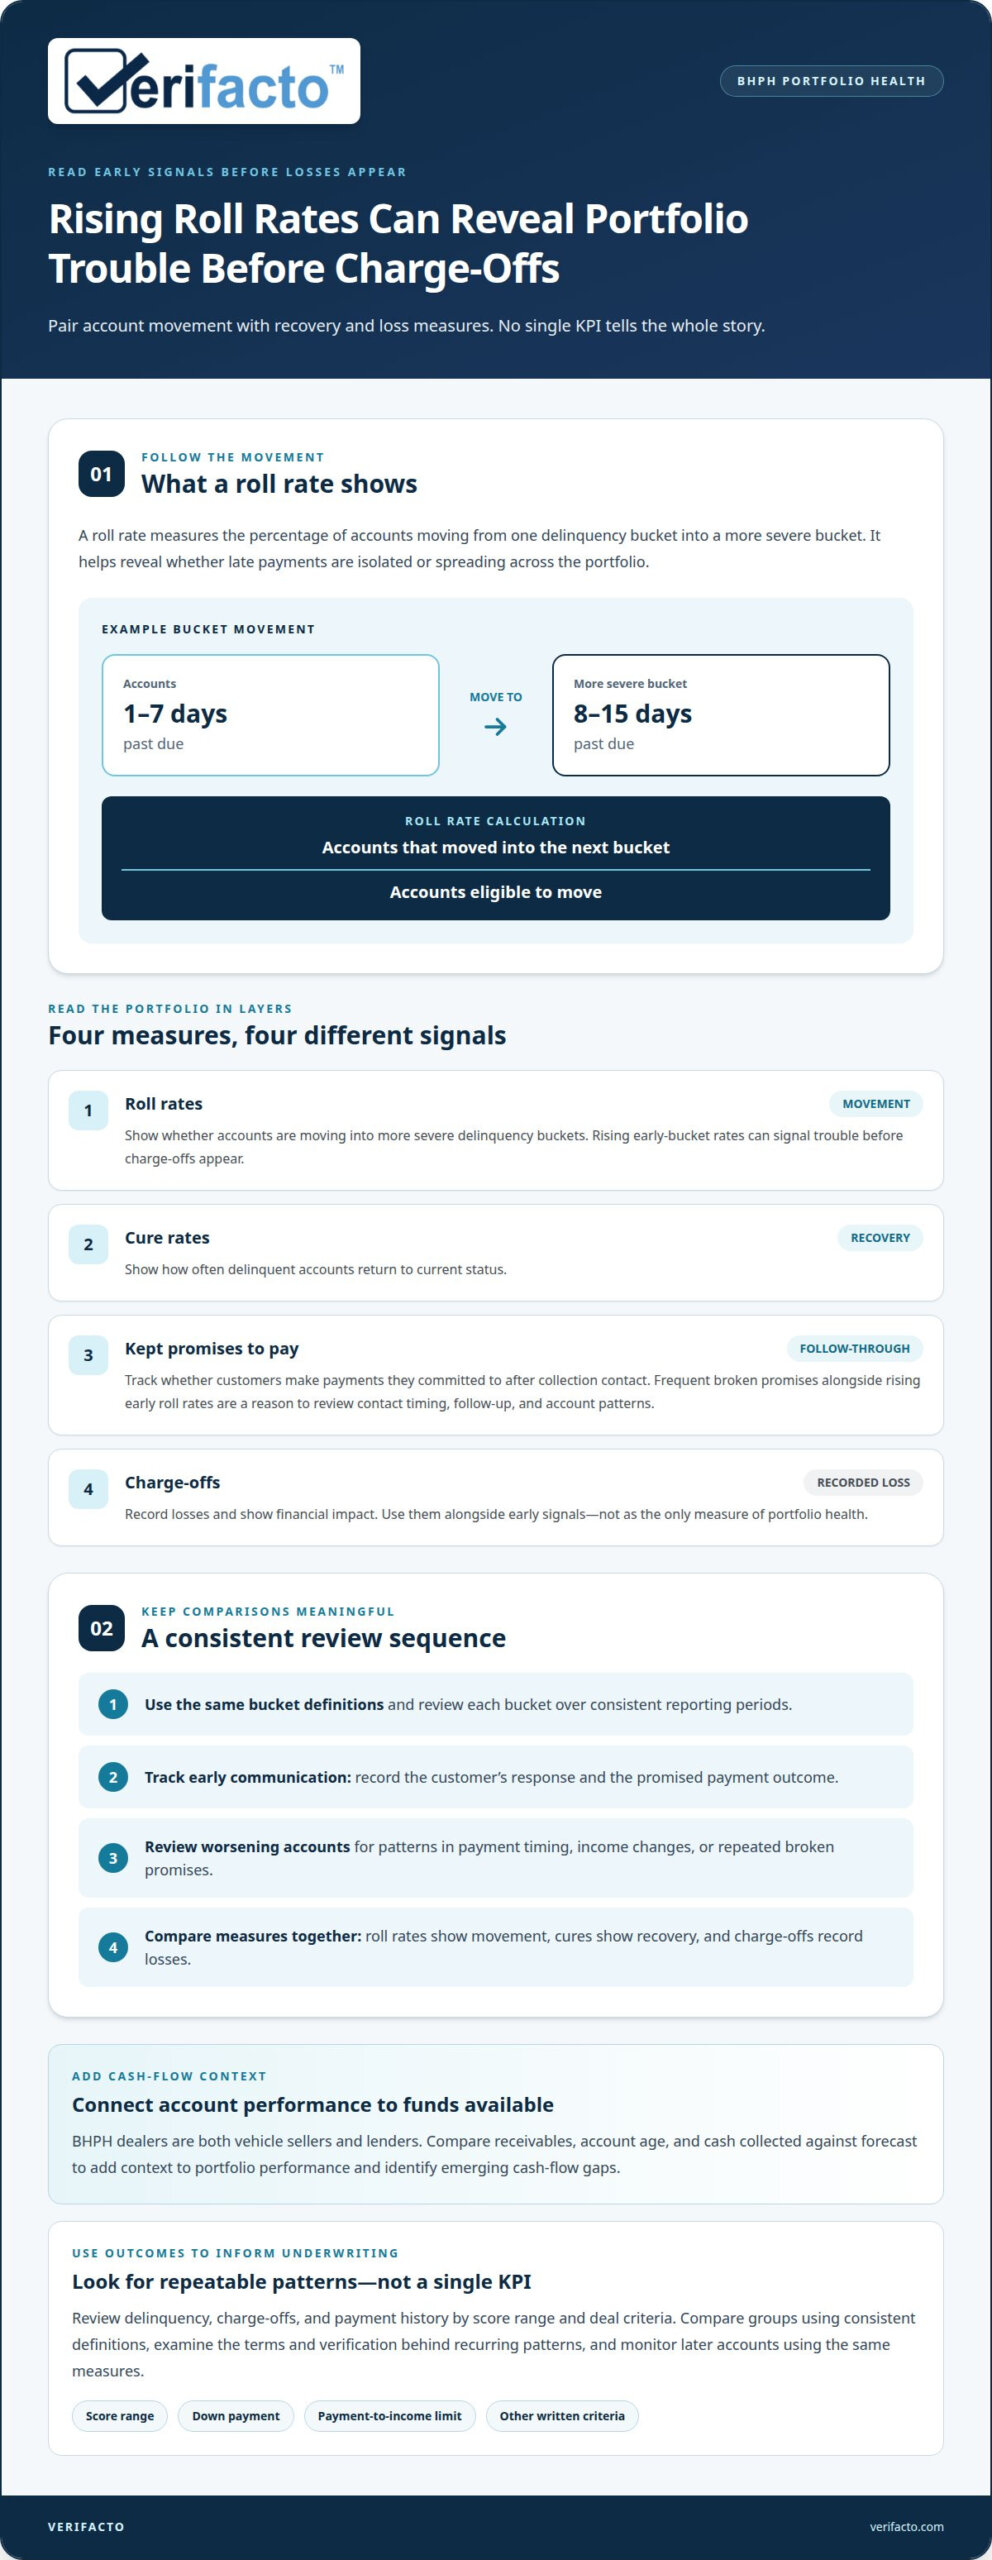
A roll rate measures the percentage of accounts moving from one delinquency bucket into a more severe bucket. For a Buy Here, Pay Here dealer, this movement shows whether late payments are isolated or spreading across the portfolio. A rising rate from an early bucket can signal trouble before charge-offs appear. Review each bucket over consistent reporting periods to spot changes, not just the total number of past-due accounts.
For example, track accounts moving from 1-7 days past due into the 8-15-day bucket. Divide the accounts that moved into the next bucket by the accounts eligible to move, then compare the result across periods. Use the same bucket definitions each time. This makes portfolio performance easier to interpret and gives collections teams a clear view of where accounts are worsening.
Pair roll rates with cure rates and kept promises to pay. An account cures when it returns to current status; the cure rate shows how often this happens. A kept-promise measure tracks whether customers make payments they committed to after collection contact. If promises are frequently broken while early-bucket roll rates rise, review contact timing, follow-up, and account patterns.
Collections and delinquency management work best as a defined sequence. Start with early communication, record the customer’s response, and track the promised payment against its outcome. Review accounts that move into more severe buckets, then look for patterns in payment timing, income changes, or repeated broken promises. Consistent collection procedures can help customers experiencing difficulty keep their vehicles and may minimize repossessions.
Collections also shape portfolio performance because a vehicle sale alone doesn’t produce the expected loan cash flow. BHPH dealers act as both vehicle sellers and lenders, so payment behavior affects receivables and funds available for operations. Compare roll rates, cures, kept promises, and charge-offs together. Each measure adds context: roll rates show movement, cures show recovery, and charge-offs record losses.
Unlike traditional auto dealerships, BHPH operators track repayment and collections alongside vehicle sales because they also hold the loan. Subprime lenders likewise monitor loan performance, while a dealer can connect account outcomes with its own sales and inventory activity. In the United States, relevant federal frameworks include TILA disclosures, FCRA consumer-report handling, and GLBA customer-information safeguards and annual privacy notices. State laws address interest rates, fees, contracts, and repossession practices.
There isn’t one current delinquency or default rate that applies to every BHPH portfolio. Historical figures cited for the sector include a 40% delinquency rate and 30% of deals failing and requiring repossession and vehicle recovery; those measures describe different outcomes, not a forecast for an individual dealer. Track each measure with consistent definitions to see how collections performance affects the portfolio over time.
2. Using portfolio performance to refine underwriting
Underwriting should learn from repayment outcomes, not rely on approval volume alone. Review delinquency, charge-offs, and payment history by underwriting score range and deal criteria. If one group repeatedly moves into serious delinquency, examine the applications and terms behind those accounts. Tracking these key performance indicators for BHPH success connects account outcomes with origination decisions and helps identify patterns without treating every customer in a group alike.
Start with a defined review process. Group closed deals by score range, down payment, payment-to-income limit, and other written criteria. Then compare later account performance using consistent delinquency definitions. For example, if accounts with similar scores perform differently across payment-to-income ranges, the payment burden may need closer review. This analysis turns portfolio results into specific questions for the next underwriting decision. Record the criteria used so comparisons remain meaningful in future reviews.
Assess ability to pay using verified income and the proposed payment. Comparing available income with the proposed payment can help inform an affordability review. Verify information supplied with the application before making a decision, and document the sources used. Employment history, residence stability, and personal references can add context to income and credit information. No single data point should replace a consistent review of the full application.
A written credit policy gives each decision a clear framework. Define acceptable debt-to-income ratios, payment-to-income limits, and down payment requirements. Include how staff evaluate credit history, income verification, employment status, residence, and references. Clear criteria help the dealership apply the same standards across applicants and provide a basis for reviewing exceptions. In a Buy Here, Pay Here business, that discipline connects the vehicle sale to the repayment relationship.
Portfolio analysis should lead to a documented action. If a defined segment shows repeated late payments, review whether its terms, payment size, or verification process differ from stronger-performing segments. Adjust policy only when the evidence points to a repeatable pattern. Then monitor subsequent accounts using the same measures. Compare later results with the original segment before deciding whether the policy change should remain in place.
- Compare: Review outcomes across score ranges and specific deal criteria.
- Verify: Confirm application information and assess income against the proposed payment.
- Document: Apply written criteria to debt, payment, down payment, and applicant history.
- Reassess: Track later performance after each policy change.
This approach makes underwriting a continuing risk-management process, not a one-time approval step. BHPH software and auto finance software can support this work when portfolio records and decision details are organized for review. Dealers can then connect each policy action to subsequent account performance, improving consistency without assuming that one customer profile guarantees a particular outcome.
3. Leading and lagging portfolio indicators
Leading indicators help BHPH dealers see emerging exposure; lagging indicators show realized results. Review both to understand whether portfolio conditions are changing and how those changes affect operations and capital. For example, increasing balances in older receivable buckets can flag pressure before net charge-offs reflect the loss. Net charge-offs measure loan losses after recoveries, expressed as a percentage of the portfolio.
Recovery rate adds another view of repossession outcomes. It measures the percentage of the outstanding balance recovered for repossessed vehicles. Compare recovered amounts with the balances associated with those vehicles, then review the results alongside net charge-offs. A weak recovery can deepen portfolio losses; contributing factors may include vehicle condition, sale proceeds, and timing of recovery.
There is no single recovery-rate or days-sales-outstanding benchmark that fits every BHPH portfolio. Recovery depends on outstanding balances and proceeds from repossessed vehicles; receivable aging depends on contract terms, payment patterns, and consistent measurement. Track the same definitions over time, then compare results across loan cohorts to identify changes.
Gross profit and vehicle cost offer operating context, but they don’t replace loan-performance measures. Treat them as reference points, not targets for every store. Acquisition and reconditioning decisions affect unit economics.
The most important KPIs include delinquency by aging bucket, roll rates, net charge-offs, recovery rate, receivable age, and cash collections against forecast. Track account movement and collection activity daily when operational decisions require timely attention. Review portfolio totals monthly, then compare loan cohorts by origination period and deal criteria. This separates newer-account performance from the results of older loans.
- Daily: Review payments posted, past-due accounts, and collection activity.
- Weekly: Examine portfolio movement, recovery activity, and cash collected against forecast.
- Monthly: Reconcile portfolio totals and review net charge-offs and receivable aging.
- By cohort: Compare delinquency, recovery, and charge-off patterns for loans grouped by origination period or deal criteria.
Effective tracking also supports a potential portfolio sale. Keep customer files, payment histories, and loan documents organized and accessible so account performance can be reviewed clearly. A consistent record trail helps explain portfolio composition to a capital source and lets leadership connect operating decisions with the results recorded in each loan cohort.
4. Receivables, defaults, and cash-flow forecasting
A BHPH sale creates a receivable, not immediate cash equal to the contract balance. The dealership must manage collections while vehicle costs, operating expenses, and incoming customer payments follow different schedules. Track cash tied up in notes, receivable age, and defaults together. These measures show how much capital remains committed and whether expected collections are arriving on time.
Build the forecast from scheduled payments, then compare gross collections and cash collections against it. Gross collections show amounts collected before adjustments; cash collections show funds received. A gap between forecast and actual receipts can point to missed payments, timing changes, or collection delays. Record the difference and investigate its cause before adjusting spending or inventory decisions.
Delinquency tracking makes that forecast more useful. Separate accounts into clear aging buckets, such as 1-7, 8-15, 16-30, 31-60, and 61-90+ days past due. Review movement between buckets alongside total dollars overdue. Accounts 11-29 days late represent serious delinquency, while accounts 30+ days late may require senior staff involvement. Apply consistent definitions so reports reveal changes rather than shifts in measurement.
Defaults affect both future receipts and the value recovered from a loan. Track default rates, receivable age, and cash tied up in notes, then assess how missed payments affect the forecast. BHPH dealers are advised to assess whether the business can sustain 60-90 days of missed payments. That stress test helps leadership understand the effect of delayed receipts on operating cash and planned decisions.
Consider the timing of the lending cycle. Dealers may manage cash flow from a financed vehicle for 12-36 months, so a forecast should account for payments over the life of the receivable. An illustrative dealership built to 800 accounts and an $8 million receivable portfolio shows how unpaid balances can accumulate alongside operating activity. The key decision is whether projected receipts support planned expenses and continued lending.
Reconcile loan accounts, principal collected, and sales tax monthly. Compare the reconciliation with the forecast and investigate differences by account age and payment status. A forecast updated against actual cash flow gives leadership a clearer basis for decisions about inventory, operating costs, and capital. It also helps prevent plans from relying on scheduled payments that have not yet arrived.
- Forecast: Project scheduled receipts and compare them with cash collected.
- Segment: Review delinquency by consistent aging buckets.
- Stress-test: Assess the effect of 60-90 days of missed payments.
- Reconcile: Match loan accounts, principal collected, and sales tax monthly.
5. Benefits of KPIs
A consistent KPI review connects daily activity with financial decisions. In a buy-here-pay-here operation, selling a vehicle begins a longer sequence: inventory is funded, a loan is created, and payments arrive over time. Tracking these handoffs helps leadership see where operational performance affects cash available for growth. For example, compare sales activity with portfolio collections before increasing inventory commitments.
KPIs make planning more specific, too. A dealership can review unit sales, receivable performance, expenses, and cash collected together instead of judging profitability by sales volume alone. If sales rise while collections fall behind expectations, the two trends tell different parts of the story. Comparing them gives management a clearer basis for decisions about inventory, operating costs, and the pace of expansion.
A dashboard reviewed monthly or quarterly creates a regular decision point. Use each review to identify a variance, assign an owner, and set a follow-up date. For example, if actual cash collections differ from the forecast, determine whether payment timing or account performance explains the gap. Record the action taken and revisit the same measure during the next review.
Keep KPI definitions stable as the business grows. If one report counts delinquency by account and another counts dollars overdue, they answer different questions. Define each measure, its data source, and its review cadence. This makes comparisons more useful across reporting periods and helps leaders distinguish a true operating change from a reporting change.
- Inventory: Review sales and available cash together before changing purchasing plans.
- Profitability: Interpret sales results alongside collections and operating expenses.
- Accountability: Assign an owner and follow-up date to each material variance.
- Growth: Use consistent measures to evaluate whether expansion fits current portfolio performance.
KPI systems support better conversations, not automatic decisions. Avoid tying employee incentives directly to individual organizational KPIs, as this can encourage gamesmanship or sandbagging. Instead, review measures as a connected operating picture. This helps a dealership recognize trade-offs, test a specific action, and assess the result without treating one number as the whole definition of success.
For a practical next step, connect KPI reporting priorities with the systems used across dealership operations. Consider how connected operational data can support clearer review of your reporting priorities.
Verifacto
Verifacto connects dealership and loan operations through Verifacto DMS and Verifacto LMS, helping teams bring portfolio activity into a clearer operating picture. When KPI reviews reveal gaps between account performance and insurance records, Insurance Tracking and CPI Solutions can support closer visibility into those areas.
For dealerships working to connect operational data with portfolio decisions, Verifacto provides an AI-powered platform across the customer and loan lifecycle. Its connected approach supports more informed oversight while keeping human judgment central to underwriting and collections decisions.
Contact Verifacto to discuss how its platform could fit your dealership’s operations.
Turn portfolio signals into your next operating decision
Strong KPI discipline isn’t about adding more numbers to a dashboard. It’s about making each measure useful for a decision: what needs attention, who will act, and when the result will be reviewed. Choose a focused set of measures tied to portfolio health and cash flow, then keep their definitions and review process consistent. This gives your team a clearer way to connect daily operations with long-term financial priorities.
The key performance indicators for BHPH success are most valuable when they lead to informed action, not simply another report. As your operation evolves, connected systems can help bring dealership and loan activity into a more usable view. Verifacto’s platform is designed to support that visibility while keeping decisions in your team’s hands.
Contact Verifacto to discuss your BHPH KPI priorities and explore a practical next step for your operation. A clearer view can help you move forward with greater control.
Frequently Asked Questions
How do “leading indicators” differ from “lagging indicators” in BHPH KPIs?
Leading indicators flag conditions that may affect future results, while lagging indicators record outcomes already realized. For example, broken payment promises can signal collection risk; net charge-offs show losses after they occur. Review both together: a leading measure helps direct attention, while a lagging measure helps assess financial impact. This pairing gives managers a more complete basis for decisions than either type alone.
What is a “roll rate” in BHPH portfolio management?
A roll rate tracks the share of accounts that move from one delinquency stage into a more severe stage. For example, follow accounts that move from an early past-due category into the next category, then compare that movement across consistent reporting periods. A rising rate can help identify worsening repayment patterns. Keep bucket definitions stable so changes in the metric reflect account movement, not a changed calculation.
What is a good collection rate for a BHPH dealership?
Measure collection rate by comparing payments received with payments scheduled for the same period. For a useful operational view, calculate it consistently and separate current accounts from past-due accounts; otherwise, strong current payments can obscure collection challenges in delinquent accounts. Review both the rate and the dollars collected. Trends across reporting periods can show whether actual receipts are strengthening or falling behind expectations.
How do you calculate BHPH portfolio yield and net charge-off rate?
Portfolio yield compares finance income earned during a period with the portfolio balance used for the calculation. State whether you use beginning, ending, or average receivables, and apply that basis consistently. Net charge-off rate compares loan losses, after recoveries, with the portfolio balance. Keep the period and denominator consistent across reports so changes reflect portfolio performance rather than a change in calculation method.
How should BHPH dealerships track cash flow and return on capital?
Build a cash-flow view from expected receipts and operating outflows, then compare actual cash collected with the forecast. Track principal collected, receivable balances, and cash committed to notes; review these alongside inventory and operating needs. To assess return on capital, relate the financial return generated over a stated period to the capital committed during that same period. Define included costs and use a consistent calculation before comparing results.
How can a BHPH dealership improve payment collections and reduce defaults?
Set payment expectations at delivery, use a consistent collection schedule, and record each contact and the outcome of promised payments. Follow up when a commitment is missed, while reviewing account circumstances before deciding what to do next. Analyze patterns by account history and deal criteria to identify where underwriting or communication processes may need attention. Clear records help collections staff coordinate follow-up and give management a stronger basis for refining procedures.
What are good BHPH recovery rates and days sales outstanding benchmarks?
There is no single recovery-rate or days-sales-outstanding benchmark that fits every BHPH portfolio. Track the same definitions over time and compare results across loan cohorts.